
")
Earned run average is a baseball pitching statistic that measures the number of earned runs a pitcher gives up per nine innings. The formula for earned run average is (9 x # of earned runs) divided by 9.
Common Questions
What are earned runs?
Earned runs are any run scored without a defensive mistake (error or passed ball). Unearned runs, on the other hand, are any run that occurs as a result of an error or passed ball.
Only earned runs are factored into a pitcher’s earned run average.
Who developed the earned run average statistic?
The Wikipedia entry for earned run average credits Henry Chadwick with developing the statistic. Not surprising since Chadwick created many of the early baseball stats.
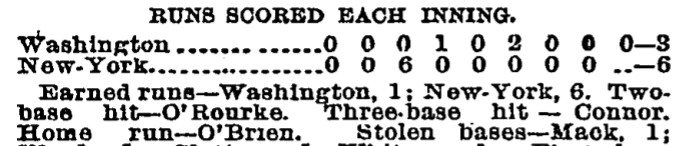
Interestingly, earned runs were being tracked as early as 1888:
If a pitcher leaves the game with a runner on base and that runner scores, which pitcher is faulted for the run?
A pitcher is also responsible for any earned runs scored by runners he allowed on base. For example, if a pitcher exits the game with a runner on second base and then that runner scores later in the inning, then the earned run counts against the exiting pitcher’s earned run average.
How do walks factor into earned run average?
Walks are not considered an error, so any player who scores a run after earning a walk will count against a pitcher’s earned run average as long as an error (or passed ball) did not enable the runner to score. The same applies if a runner scores from third base due to the hitter walking (note: this occurs when the bases are loaded, and the runner on third base is forced to advance home due to the runners on second and third base).
Is a lower earned run average (ERA) better in baseball?
Yes, a lower earned run average is better in baseball. Earned run average measures how many earned runs a pitcher gives up every 9 innings, so fewer runs allowed is better for the pitcher.
How well does earned run average (ERA) evaluate relief pitchers?
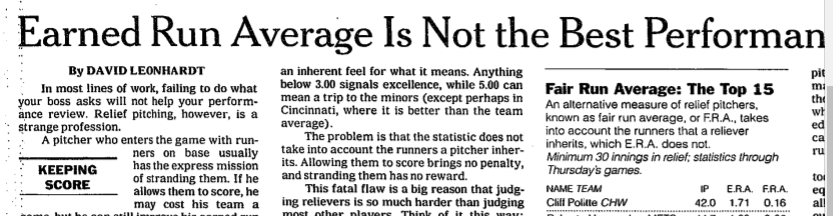
On one hand, earned run average evaluates relief pitchers just like other pitchers since the calculation has not changed. However, relief pitchers often enter the game with a runner on base, but are not held accountable (in terms of ERA) if that inherited runner scores.
David Leonhardt talked about this issue in a New York Times article back in 2005, and spotlighted the F.R.A. (Fair Run Average) metric that the writers at Baseball Prospectus had developed. This metric accounted for the runners that relief pitchers inherited in order to fairly compare all relief pitchers.
![]()
What is a good earned run average (ERA) in baseball?
As a prior question explained, lower earned run averages are better than higher. But what earned run average is expected? Just how low does a pitcher’s earned run average need to be in order to be considered excellent?
One way to answer this question is to look at the earned run average for the Cy Young Award winner (award given to the best pitcher in the National League and American League each year) and ERA leaders for the NL/AL for the last fifteen years to get an idea. Note: to qualify for the ERA title, a pitcher must pitch at least 1 inning per team game played (i.e., if a team plays 162 games, then a pitcher would need to pitch at least 162 innings in order to qualify for the ERA leaderboard).
| Year | NL Cy Young Winner | NL ERA Leader | AL Cy Young Winner | AL ERA Leader |
|---|---|---|---|---|
| 2020 | Trevor Bauer – 1.73 | Trevor Bauer – 1.73 | Shane Bieber – 1.63 | Shane Bieber – 1.63 |
| 2019 | Jacob DeGrom – 2.43 | Hyun-jin Ryu – 2.32 | Justin Verlander – 2.58 | Gerrit Cole – 2.50 |
| 2018 | Jacob DeGrom – 1.70 | Jacob DeGrom – 1.70 | Blake Snell – 1.89 | Blake Snell – 1.89 |
| 2017 | Max Scherzer – 2.51 | Clayton Kershaw – 2.31 | Corey Kluber – 2.25 | Corey Kluber – 2.25 |
| 2016 | Max Scherzer – 2.96 | Kyle Hendricks – 2.13 | Rick Porcello – 3.15 | Aaron Sanchez – 3.00 |
| 2015 | Jake Arrieta – 1.77 | Zack Greinke – 1.66 | Dallas Keuchel – 2.48 | David Price – 2.45 |
| 2014 | Clayton Kershaw – 1.77 | Clayton Kershaw – 1.77 | Corey Kluber – 2.44 | Felix Hernandez – 2.14 |
| 2013 | Clayton Kershaw – 1.83 | Clayton Kershaw – 1.83 | Max Scherzer – 2.90 | Anibal Sanchez – 2.57 |
| 2012 | R.A. Dickey – 2.73 | Clayton Kershaw – 2.53 | David Price – 2.56 | David Price – 2.56 |
| 2011 | Clayton Kershaw – 2.28 | Clayton Kershaw – 2.28 | Justin Verlander – 2.40 | Justin Verlander – 2.40 |
| 2010 | Roy Halladay – 2.44 | Josh Johnson – 2.30 | Felix Hernandez – 2.27 | Felix Hernandez – 2.27 |
| 2009 | Tim Lincecum – – 2.48 | Chris Carpenter – 2.24 | Zack Greinke – 2.16 | Zack Greinke – 2.16 |
| 2008 | Tim Lincecum – 2.62 | Johan Santana – 2.53 | Cliff Lee – 2.54 | Cliff Lee – 2.54 |
| 2007 | Jake Peavy – 2.54 | Jake Peavy – 2.54 | CC Sabathia – 3.21 | John Lackey – 3.01 |
| 2006 | Brandon Webb – 3.10 | Roy Oswalt – 2.98 | Johan Santana – 2.77 | Johan Santana – 2.77 |
This list helps us get an idea of the expected earned run average for the best pitchers each year, but what about the average pitcher?
Earned run averages vary depending on the season (e.g., changes to the baseball can influence offensive production).
| Season | All Pitchers | Starting Pitchers | Relief Pitchers |
|---|---|---|---|
| 2018 | 4.15 | 4.19 | 4.08 |
| 2019 | 4.51 | 4.54 | 4.46 |
| 2020 | 4.45 | 4.46 | 4.44 |
| 2021 (through 4/23) | 4.06 | 4.03 | 4.09 |
Why are earned run averages typically higher in the American League?
Earned run averages in the American League are typically higher due to the designated hitter. You can look at the stats in detail below, but designated hitters performed significantly than pitchers at the plate (approx. twice as well). For example, the splits comparison:
| Season | Batting Average | On-Base Percentage | Slugging Percentage |
|---|---|---|---|
| 2018 | .115 vs. .254 | .144 vs. .329 | .148 vs. .457 |
| 2019 | .128 vs. .252 | .160 vs. .339 | .162 vs. .467 |
| 2021 (through 4/23) | .110 vs. .249 | .140 vs. .321 | .131 vs. .458 |
With the increased production, it is no surprise more runs are scored by American League teams than National League teams.